Overall Enrollment
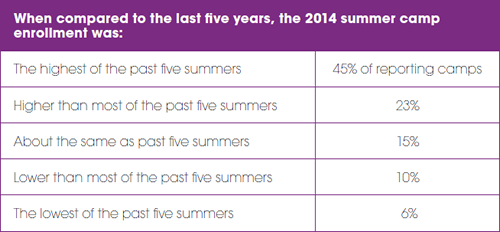
Total camper enrollment is trending upward beyond the low reported in 2009. Seventy-nine percent of camps reported their total enrollment for 2014 was the same or higher than the previous year, a continuation of a trend we have noticed for the past five years. This upward trend is great news for the industry as a whole, yet it is important to remember that one out of every five camps reported lower enrollment in 2014.
Significant differences existed across camp affiliation categories. In 2014, for example, 72 percent of agency-affiliated camps reported higher enrollment compared to 2013, while 32 percent of religiously affiliated camps reported lower enrollment. The chart below displays directors’ perceptions of enrollment in their camps in comparison to the last five years
Enrollment by Gender and Age
Enrollment trends by gender were similar for both boys and girls, and the percentage of camps with lower enrollment of boys or girls has steadily decreased each year. The number of camps reporting their enrollment was about the same as the previous year has remained relatively stable.
There were some significant differences in enrollment for boys across camp affiliation in 2014. Survey wide, 11 percent of camps had lower enrollment of boys, 46 percent the same, and 43 percent higher. For-profit camps were unique, with 22 percent reporting lower enrollment for boys, 30 percent the same, and 48 percent reporting higher enrollment. Religiously affiliated camps reported the most stable enrollment for boys with 59 percent of camps having the same enrollment as last year.
Enrollment by age group was also very interesting. This year, only 11 percent of camps reported lower enrollment for campers ages nine and younger, 42 percent reported the same, and 47 percent reported higher enrollment. Day camps were surprisingly lower on enrollments for this age group with 23 percent of day camps reporting lower enrollment and 26 percent staying the same as 2013. While 51 percent of day camps reported an increase in 2014, the high percentage of lower enrollment coupled with the smaller percentage of camps staying the same is something to keep an eye on, especially considering that day camps are often identified as being a strategy for getting youth involved at a young age.
Diversity
Diversity is an important issue at ACA. As we work toward our 2020 Vision, it is encouraging to see positive enrollment trends for campers from a minority racial group or ethnic background.
In 2014, 27 percent of camps reported having higher enrollment of minority campers, compared to 16 percent in 2013. This increase, along with the corresponding drop in the percent remaining the same, was driven by day camps. Forty percent of day camps reported higher enrollment of minority campers in 2014, and 55 percent reported the same as 2013.
These increases are particularly important considering the difference between the demographics of ACA campers when compared to national projections. While regional differences in populations exist, there appears to be an opportunity for camps to increase enrollment among campers who are Hispanic, black, or African American.
Overall, camps reported the following regarding the economic level of the families served: 12 percent of camper families were in poverty, 16 percent of families were low income, 47 percent of families were middle income, and 33 percent of families were high income.
Financial Assistance and Scholarships
Overall, 57 percent of camps reported that they agreed or strongly agreed with the statement: “We had more requests this year for camp scholarships than last year,” and 83 percent of camps reported that they agreed or strongly agreed with the statement: “We were able to provide camp scholarships to campers that requested them.”
Looking Ahead
So what do the enrollment trends from 2014 tell us? First, it was a good year for most camps. Sixty-eight percent of camp directors reported they either disagreed or strongly disagreed with the statement: “The economy negatively affected my camp’s enrollment.” This finding indicates we might be moving beyond the impact of the economic downturn and should begin to look at other factors that influence enrollment.
The opinions of directors regarding 2014 enrollment factors provided interesting insights into potential challenges. For example, 90 percent of the directors disagreed or strongly disagreed with the statement: “Weather or natural disasters negatively affected my camp’s enrollment,” and 75 percent disagreed or strongly disagreed with “More parents enrolled their children in shorter sessions than last year.” On the flip side, 57 percent agreed or strongly agreed that “Changes in the school calendar negatively affected enrollment,” and 53 percent of the directors agreed or strongly agreed that “Children in my camp’s service area had more summer opportunities that resulted in greater competition with us.”
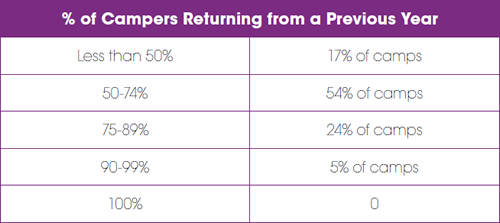
One factor that hasn’t been mentioned thus far is the importance of camper retention. In all of the graphs we examined, the highest percentages of camps reported that enrollment stayed about the same compared to the previous year. Returning campers made up the majority of this group. The lesson is straightforward and we all know it well: In the quest to attract new campers, we must make sure the experience of our current campers is of a high enough quality that they want to come back again next year.
A second lesson that can be taken from the 2014 enrollment trends is specific for individual camps: If enrollment at your camp does not match the trends, ask yourself why. Honest self-assessment might lead to changes or improvements that can make a difference. One self-assessment tool you might consider is the CPQA Staff Behaviors Checklist available here. Not only will camp staff at all levels benefit from thinking about these best practices and rating their own behaviors, but quality staff performing at high levels usually result in campers who want to return.
We would like to thank each director who participated in the 2014 Enrollment Survey. The trend information shared in this article was made possible by your willingness to participate in this study. If you weren’t able to in 2014, please consider contributing your camp’s information this year. The more camps participate in the survey, the better the information we all have to compare our individual experiences.
Enrollment highlights prepared by Troy Bennett. Troy is the ACA research assistant at the University of Utah.


