All camp administrators want their business operations expenses to end up on the positive side of the budget ledger. However, many directors are unaware of how their expenses and revenues compare to other camps' business operations. Every three years the American Camp Association (ACA) collects this information in the ACA Camp Business Operations Survey. In the fall of 2014, we asked a 75-percent random sample of our ACA-accredited camps to share their business data for revenues, expenses, weekly registration costs, scholarships and discounts, and marketing techniques. The following highlights from their answers provide general insights into the business side of operating a camp, as well as break-outs based on camp type (day camp, overnight camp, or rental camp).
Total Gross Revenue
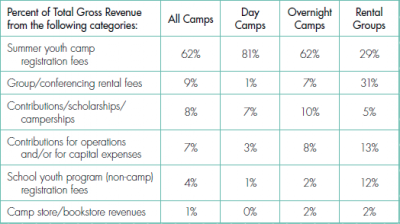
Revenue generation for any camp is a critical aspect of the business. Unless a benefactor supports the camp, the welcome sign will have to come down if the dollars aren't generated to support the program in a quality way. Many camps look for creative ways to generate income, but as expected, the majority of the revenue comes from camper registrations. The average camp's gross revenue in 2014 was $1.28 million with overnight camps realizing the highest revenues ($1.42 million) followed by rentals ($1.30 million) and day camps ($1 million).
- Sources of revenue were markedly different based on the camp type. On average, 62 percent of revenue comes from
- Summer Youth Camp Registration Fees. This was markedly different between camps that identify as primarily overnight camps, primarily day camps, and primarily rental groups (see Table 1).
- Because camper registration is critical to revenue generation, a look at 2014 weekly fees provided important details:
- Overnight camp average weekly fee was $704. Fifty-eight percent of surveyed camps reported the fee increased from 2013, while 38 percent noted the fee stayed the same.
- Day camp average weekly fee was $271. Forty-seven percent said the fee increased from 2013; for 41 percent it stayed the same.
Camps that indicated fee increases in 2014 compared to 2013 based them on:
- Increased cost of living (60 percent)
- Increased cost of inputs (50 percent)
- A desire for higher profit margin (18 percent)
- Increased demand for programs (14 percent)
Table 1. 2014 Percentage of Gross Revenues
Expenses
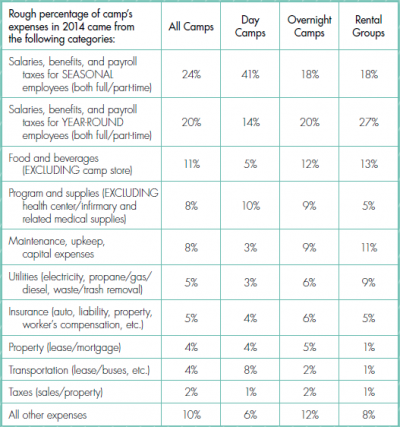
The other half of the camp ledger is focused on expenses incurred by the business. Ideally, camps look for ways to be cost-effective and thrifty when analyzing their expenses. Based on the information shared by directors, the average camp expenses in 2014 were $1.16 million but varied greatly by type of camp. For example, overnight camps average expenses were $1.3 million dollars, followed by rental camps ($1.27 million) and day camps ($790,000).
- On average, salaries were the largest expense (44 percent of camp expenditures with a slightly higher percentage going toward seasonal employees) with interesting differences across camp types (see Table 2). For example, percentages for year-round employees' salaries for overnight and rental camps were significantly greater than for day camps.
- The expense percentages confirmed common perceptions, such as day camps have higher transportation expenses while overnight camps spend more on food.
Table 2. 2014 Percentages of Camp Expenditures
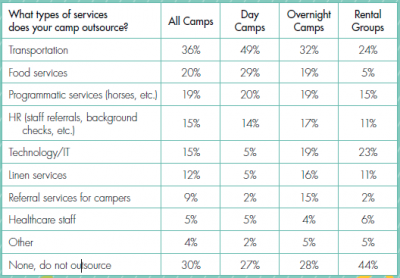
A new question on outsourcing generated interesting ways of re-directing responsibility for some of the expense categories. While almost a third of the camps did not outsource any of the expense categories, it was interesting to see the percentages for the various services that were outsourced (see Table 3).
Table 3. Outsourced Services
Scholarships and Discounts
For some camps, scholarships are critical to their survival. For others, scholarships are a nice option to help more campers experience their program. The directors shared that the average total dollar value of scholarships awarded to campers in 2014 was $77,700 and resulted in about 24 percent of their campers receiving full or partial scholarships.
- As expected, the average overnight camp awarded more scholarship dollars ($89,100) than did the average day camp ($40,800).
- Overnight camps awarded scholarships to about 27 percent of their campers while day camps supported about 17 percent of their campers.
Over 80 percent of the camps surveyed offered some type of discount in 2014. The average total dollar value of discounts provided to campers in 2014 was $53,300 and resulted in 30 percent of all campers receiving some type of discount.
- Day and overnight camps average discounts were $56,100 and $60,600, respectively.
- About 35 percent of day campers and 30 percent of overnight campers received a discount.
Marketing Strategies
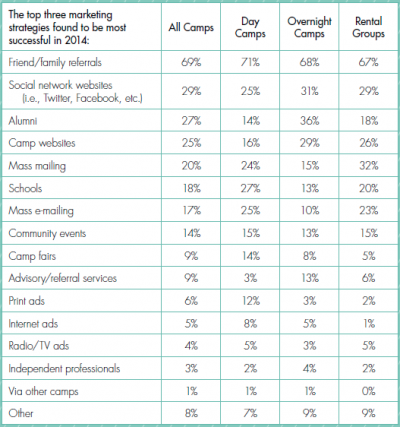
Some directors suggest that marketing is the key to operating a financially successful camp business. When asked, directors said their most successful marketing strategy by far was referrals by families and friends followed by social media, alumni, and their websites (see Table 4).
Top Three Marketing Strategies
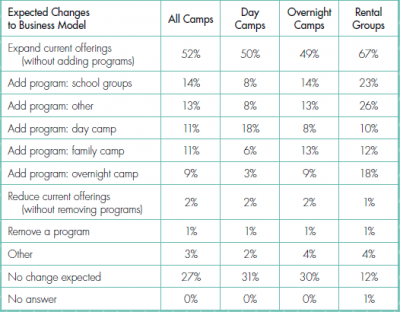
Expected Changes to Business Model
Lastly, camps were asked, "In which of these ways do you expect your camp business model to change in the next three years?" About one in four directors said they anticipated no change to their business model. Of those directors who thought they would
have changes, the most popular change was to expand their current offerings without adding programs, add school groups, add
other types of groups, add a day camp, or add a family camp program (see Table 5).
Table 5. Expected Business Model Changes
So What?
Understanding the business side of camp is critical to the success of most camps. Information shared through outlets such as the ACA Camp Business Operations Report: 2015 are full of information that can help camps benchmark their realities with other similar kinds of camps. While this article focused on comparisons by camp type, these reports offer additional breakouts by other camp characteristics such as sponsorship (agency, religiously affiliated, independent nonprofit, independent for-profit), geographic regions, revenue size, camper days, and profitability. The business operations' information shared by directors in this survey:
- Confirmed general perceptions about leading sources of revenue (primarily camper registrations) and expenses (salaries) with a nod to the differences based on camp type
- Described the important roles played by scholarship and discount dollars that allow children who might otherwise not attend camp to have that experience.
- Confirmed the importance of word-of-mouth recommendations to attend a particular camp
- Offered insights into the types of changes to business models that were being considered
Hopefully, when asked to "show us the money," camp administrators can translate these facts and figures in a way that demonstrates the sound business acumen that results in quality programs, safe settings, and caring adults that turn dollars and cents into the experience of a lifetime. We gratefully acknowledge all of the directors who completed the business operations survey in 2014. For more information about the ACA Camp Business Report:2015, go towww.ACAcamps.org/research/improve/2015-business-operations.
Troy Bennett, MBA, is a graduate research assistant for ACA.

