Hello camp community!
In my last blog post I shared with you the 2019 Staff, Compensation, and Benefits Report and explained that we received less responses to that survey than we have in the past. I encouraged readers of that report to interpret the findings with caution because they might not represent all camps or all situations.
In this post I will explore the concept of sample size so we can better understand why we need to interpret the findings with caution and how we determine the right number of responses to surveys like this one. I will use the Staff, Compensation, and Benefits Report as an example, which will help keep this very complex concept a little more straightforward.
First, some definitions.
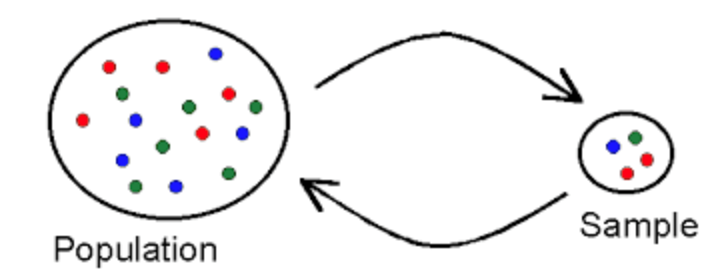
Population: All possible people (or, in this case, camps) that you want to say things about based on the survey project. In this example, the population can either be all possible camps in the US, or all ACA member camps. You’ll see why this difference matters later on.
Sample: Subset of the population that receives the survey. Ideally that sample is selected such that it represents the larger population, not just a specific segment of the population (a sample of all green dots, for example, per the image below).
Response rate: The percentage of the sample that responds to the survey. This number can be high or low depending on the sample size — in some cases, a low response rate is fine as long as the sample was large, or if it is consistent with similar past surveys. What’s important to consider is who did respond and who did not — did only certain types of people from your population respond? Is there a pattern among the people that did not respond?
Confidence level and confidence interval (a.k.a. margin of error): I group these not because they are the same thing, but because they are factors that statisticians consider when calculating sample size by you probably will not. Together these measures tell us how certain we can be that the mean values (or average) in our data represent the actual mean in the larger population. For this exercise, we will use the generally-accepted values of 95 percent confidence level and +/- 5 percent margin of error.
Now let’s look at our example.
Population
We can look at this in two ways:
Population Option A:
|
Population Option B:
|
| At the time of this survey, this was 2,844 camps; however this number excludes camps who have opted out of receiving surveys like this, so the actual population is closer to 3,000. | We estimate there are about 14,000 camps in the US, although this is a very rough estimate. |
So, which do we use? If we wanted to say things about ACA member camps, but not about camps in general, then we would use 2,844 as our population. But we often use the data we gather from surveys like this to make estimates about camps in general, like the total number of staff working at U.S. camps and total number of youth served.
Sample Size
You can find out your ideal sample size either by using this calculation:
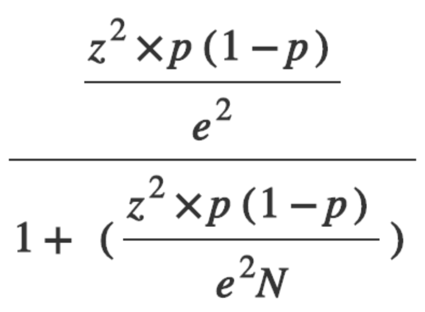
Or by using one of many online sample size calculators.
| Population Option A: All ACA member camps |
Population Option B: All camps in the US |
| Ideal sample size based on a population of 2,844, a confidence level of 95 percent, and a +/- 5 percent margin of error would be 339. |
We estimate there are about 14,000 camps in the US, although this is a very rough estimate. Using an online sample size calculator we get a target sample size of 374. Not much more, right? That’s because we assume that the 14,000 camps are not characteristically different than the 2,844 camps. But this is not a safe assumption, so a +/- 5 percent margin of error is probably too high, meaning this estimated sample size is too low. |
Response Rate
This is the first thing we tend to look at when collecting data with a survey. A large response rate is always better, right? Not necessarily.
A total of 426 camp directors responded to the 2019 Camp Staff, Compensation, Benefits Survey, which represents an 18 percent response rate. To know if this is good or bad we need to consider:
- What is a typical response rate for surveys like this? In this example: ~40 percent
- How close is the response rate to our target sample size? In this example: Exceeds it by almost 100 responses
- Who responded? Does this group represent the larger population? In this example: sort of. Among the 426 respondents we had slightly more independent nonprofit, agency, and faith-based camps than we have in the ACA member camp population, so it is possible the responses are biased.
- Who did not respond? The obvious problem here is that we only have access (via email addresses) to ACA member camps, and we know very little about the camp population outside of our membership. It is very likely the larger camp population includes more municipal parks and recreation camps, or camps on college campuses, and thus there is likely a bias here as well.
In this case the problem is not so much in the 18 percent response rate, but rather what happens when we start to slice the data up. To understand this, let’s look at margin of error.
Margin of Error
Earlier I defined margin of error as the range within which you’d get the same responses that you got from your sample if you surveyed everyone in your population of interest. In the case of the 2018 Camp Staff, Compensation, and Benefits Survey, we would ideally say that if we gave the survey to 100 randomly selected camp directors in the general population, 95 of those responses would fall plus or minus X percentage points of the average scores from the sample.
Example: According to the results of this survey, the average camp hires 74 seasonal staff.
Ideally, if I asked that question of 100 camp directors in the general population, 95 would respond somewhere within +/- 5 percent of 74, so between 73.5 and 74.5.
Unfortunately, this starts to get shaky when we look only at overnight camps or only day camps. With only 231 of the total sample representing overnight camps, we can assume a 5.9 percent margin of error when we pull out just the overnight camp data. For the day camp data we assume an even larger margin of error (6.9 percent), and larger still as we break the sample into even smaller sub-groups.
So, what is sample size?
Sample size is one of several criteria we use to plan for and to interpret research. Through sampling we can get higher quality data, which is data that we can be confident represents what is actually happening in the world. If we are using a sample to make predictions about a larger population, then the sample should be a certain size and fall within acceptable values for confidence levels and margin of error.
But….
Sample size is not the only information we should consider when interpreting research. First, as we can see in the case of the 2019 Camp Staff, Compensation, and Benefits Report, a decent response rate does not mean we have the ability to break the data into smaller chunks, nor does it mean that the data truly represents the population.
Second, the ideal sample size depends on the research questions, the methods you choose to explore those questions, and how you plan to use the data you gather. Qualitative research, for example, typically uses a much smaller sample (sometimes as low as 1!). Evaluation projects you might do at camp are another place where sample size might not be ideal, at least in the very early stages of the project. In these cases, sample size (or, more accurately, response rate) is most useful as a measure of your community and their willingness to share their time and perceptions with you, so your goal, over time, would be to increase that number as you improve the ways you gather evaluation information.
Which is the perfect place to conclude what could be a much, much larger conversation about sample size and predictive statistics. For those with the appetite for that….Google it. Everyone else, I hope this blog at least gives you some ways to analyze the data available to you (for free!) in the 2019 Camp Staff, Compensation, and Benefits Report.
Happy evaluating!
Laurie Browne, PhD, is the director of research at ACA. She specializes in ACA's Youth Outcomes Battery and supporting camps in their research and evaluation efforts. Prior to joining ACA, Laurie was an assistant professor in the Department of Recreation, Hospitality, and Parks Management at California State University-Chico. Laurie received her Ph.D. from the University of Utah, where she studied youth development and research methods.
Thanks to our research partner, Redwoods.

Additional thanks goes to our research supporter, Chaco.
Photo courtesy of Camp Woodhaven in West Boylston, MA


