After reviewing the results of the 2015 Enrollment Survey, in general, camps had a good year as enrollment continued to rise. The majority of camps reported at least maintaining the same enrollment numbers compared to 2014, and, in many cases, they were higher. Generally, the camps in the sample were representative of overall ACA membership (231 camp directors responded). The following data, charts, and graphs are based on camp directors’ responses. These enrollment trends may not apply to every camp, but ACA hopes this information will help provide insight into the industry trends as a whole.
Overall Enrollment Compared to 2014
Many camps saw growth in enrollment numbers in 2015. The majority of camps (61 percent) indicated their enrollment was higher than last year. When looking at the past five years, 44 percent of camps said their enrollment was the highest it has ever been, and 21 percent said it was higher than most summers. About 86.4 percent of camp directors noted returning camper enrollment was about the same as last year or higher. Some camp directors (18 percent), however, noted lower enrollment. These responses came predominantly from independent, not-for-profit camps. A few regional differences were found, particularly with Chesapeake and Keystone camp directors, who reported lower enrollments more often than not.
Camper Demographics
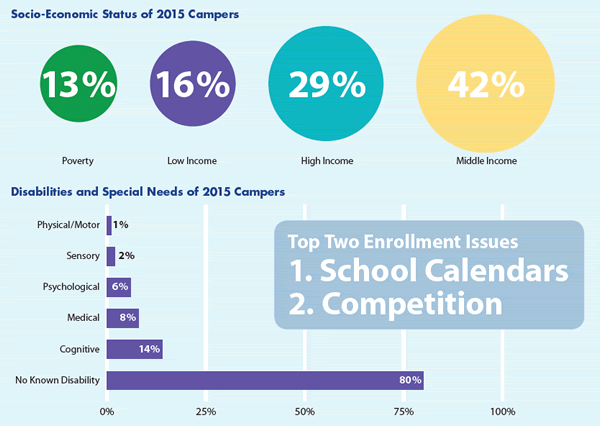
The majority of campers were reported as being Caucasian (77 percent) and from middle-income families (42 percent), which is consistent with years past. Even so, camps served youth from diverse backgrounds: black/African-American (9 percent), Hispanic (6 percent), Asian (4 percent), multi-racial (4 percent), and other (3 percent). Socioeconomic status also varied, including campers from low-income families (16 percent) and some living in poverty (13 percent). Many campers had no known disabilities (80 percent). Those who did have a disability had cognitive limitations (14 percent), medical needs (8 percent), psychological issues (6 percent), sensory impairments (2 percent), and physical/motor disabilities (1 percent) — more than 100 percent due to estimation error. Many camps served youth from other countries as evidenced by the fact that about one out of ten camps hosted international campers in 2015.

Gender and Age
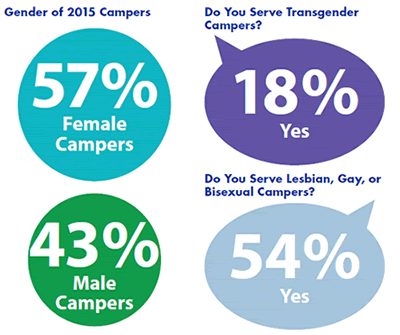
Campers in general were predominantly female (57 percent). Boys’ enrollment remained relatively the same for day camps, whereas overnight camps saw higher enrollment this past summer. A majority of campers were 12 and younger (71 percent). However, the majority of camps also reported having higher enrollment for campers 13 and older.
Lesbian, Gay, Bisexual or Transgender (LGBT) Campers
Approximately 18 percent of camps served youth who identify as transgender. About 54 percent of camps served youth who were lesbian, gay, or bisexual. However, significant differences existed between day and overnight camps, with day camps hosting fewer lesbian, gay, and bisexual youth than overnight camps.

Scholarships and Financials
Agency, for-profit, and religiously affiliated camps agreed the economy did not negatively affect them, while independent not-for-profits felt that it did affect them. For the majority, 76 percent of camps felt they did not have reduced funds for scholarships. The requests for scholarships from campers remained similar to the past several years, and seven out of ten camps strongly agreed or agreed that they were able to provide scholarships to those campers who requested them. However, for-profit camps differed from this viewpoint when they indicated they were not able to provide camp scholarships to those who requested them.
Top Enrollment Issues
Camps were asked in an open-ended question to report the top two enrollment issues they faced this past summer. Many of these issues were consistent with those mentioned in years past. The order of the most frequently mentioned issues was:
- School calendars impacted by snow days pushed school further into the summer.
- Competition from other youth programs and lower-priced camps in the area affected enrollment and recruitment. Recruiting and marketing to reach out to new campers was difficult.
- Parents enrolled their children later in the year and requested last-minute registrations, even though approximately 60 percent of camps offered early registration discounts.
- Parents wanted shorter sessions. Camps reported five days to two-week sessions as most popular. Many camps said shorter sessions allowed more flexibility for parents planning summer activities for their children. Some camps also reported parents becoming increasingly uncomfortable sending youth to camp for longer periods of time.
Key takeaways:
- Across the board, regardless of demographics such as gender or age, enrollment was higher than in 2014, and highest for the past five years. For camps not following this trend, they may want to consider issues related to program quality as well as enhanced marketing and recruitment strategies.
- Marketing is an area that camp directors may want to explore further. Even though children are coming to camp and enrollment is high, marketing efforts should continue to be evaluated and adapted, if necessary. An area camps may want to focus on is trying to target new markets for recruitment. Camps may also want to do additional marketing for their discounts or scholarships offered to promote enrollment.
- Even if campers have not openly identified as LGBT to management, it is very possible camps are still serving youth who are. ACA has resources camps can use to gain insight into this topic. Camping Magazine has included articles on LGBT campers and staff in the past (see “Does Your Camp Reinforce, Resist, or Relieve Gender Stereotypes,” March/April 2012, and “Out and About: Creating a Safe Environment for LGBT Campers and Staff,” May/June 2013). Online courses include Transgender Staff at Camp and Talking Transgender at Camp, and numerous resources are available in the Resource Library.
We would like to thank each camp director who participated in the 2015 Fall Enrollment Survey. The trend information shared in this article was made possible by these camp professionals’ willingness to participate in this study. We hope you will consider contributing your camp’s information next year. The more camps that participate in the survey, the better the information we all have with which to compare our individual experiences.
For more details, please visit the ACA website: ACAcamps.org/resource-library/research/camper-enrollmentstaff-recruitment-reports
Enrollment highlights prepared by Cait Wilson. Cait is the ACA research assistant and is pursuing her doctoral studies at the University of Utah.

