Trends in camp business operations are altogether interesting and not interesting. Interesting because the business of camp is dynamic and evolving quickly to meet the demands of the 21st century, and not interesting because, by and large, the business of camp boils down to one thing: it depends. The 2018 Camp Business Operations Report included both interesting and not-all-that-interesting findings, mostly due to the fact that camps today are increasingly diverse, representing a wider range than ever before in size and financial scope.
The diverse nature of camps in the US makes researching these camps, and finding meaningful and representative trends, quite difficult. This is why ACA enlists the help of an external research firm each year to help design, administer, and analyze a survey of our member camps. In the fall of 2017, the focus of this survey was on camp business operations, which includes enrollment fees, other sources of revenue, scholarships and discounts, expenses, and overall profitability. Camp directors use this information to see how their camp is positioned relative to others with the same camp type and/or affiliation in terms of business operations. ACA uses this report to secure business partnerships and advocate for the camp industry to policy makers and potential corporate sponsors. The results, available in the 2018 Business Operations Report, are available for purchase.
To accurately represent the diverse nature of ACA camps, camp participants were selected based on their primary mode of operation, affiliation, and region. Each of these 2,106 ACA-accredited and member camps received hard-copy surveys in the mail, but had the option to respond online or to return a paper survey by mail. The research team received a total of 865 usable responses, which represents a 41-percent response rate with proportionate representation of day and overnight camps, and camps of various affiliations and regions. Camps that responded to the survey were given the option to share their email to receive a free copy of the final report.
Enrollment
For the purposes of financial analysis, camps were asked to report their enrollment in terms of “camper/person days,” a number that represents the total number of campers per day multiplied by the number of days of program operation (e.g., 100 campers per day x 5 days in operation = 500 camper days). We use this measure because it accounts for repeat campers and length of operation, thereby giving us a statistic to compare enrollment across vastly different camp types.
A note on how we measure “typical”: The mean (a.k.a. average) is the go-to metric for what is “typical” in a given population; however, because camps are so diverse, a small number of very big camps or very small camps can make the mean less realistic. The median is a measure of central tendency that does not allow outliers, like really big or small camps, to skew the data; so, with camps the median is often a better measure of typical than the mean. For the most part, we present the median throughout this article. Chart 1, however, is best interpreted as a “mode,” which represents the most popular or common response. In 2018, almost 25 percent of overnight camps had between 5,000 and 9,999 camper days, while there was a lot of variation in camper days among day camps.
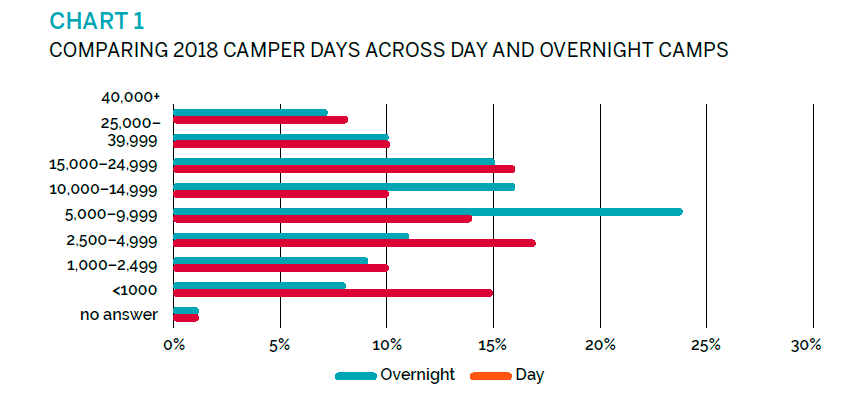
The key takeaway regarding enrollment from the 2018 Business Operations Report is that, in 2017, day camps had a higher number of camper days (6,800 camper days) than overnight camps (5,300 camper days), and among day camps, independent, for-profit camps served significantly more campers (12,100 camper days) than independent, nonprofit, agency, or religiously affiliated camps. Among overnight camps, agency-based camps appeared to have the highest median number for camper days (13,000 camper days) compared to camps of other affiliation types.
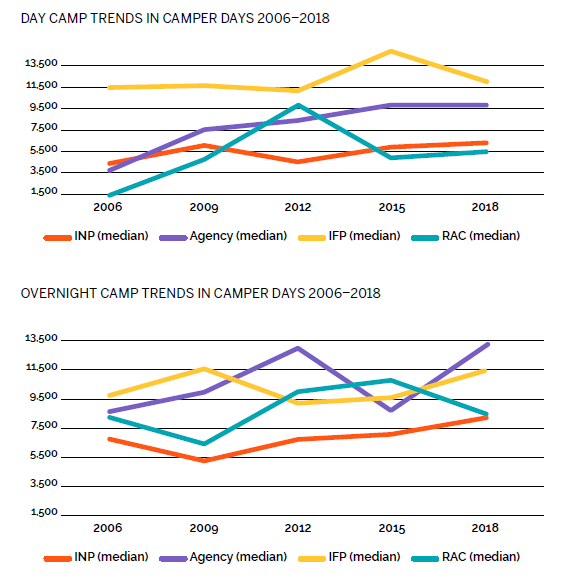
Enrollment has fluctuated among both day and overnight camps over time, with some of the most notable changes among independent nonprofit and religiously affiliated camps. Measures of unique camper enrollment, such as those assessed in the 2017 Site, Facilities, and Programs Survey, indicate that the overall number of campers served is on the rise, which suggests the somewhat flat nature of the camper days statistic over time is capturing a growing trend toward increased days of operation.
Revenue and Expenditures
The diversity in size and scope of ACA camps is evident in the 2018 Business Operations findings related to revenue and expenditures, so once again we rely on the median as the best indicator of what a “typical” camp might be like. In 2018, median revenue for day camps was $387,000 (although 19 percent of day camps reported revenues in excess of $1 million), which most commonly included revenue streams related to program fees and contributions/donations. Revenue varied slightly less across overnight camps, with a median 2018 revenue of $1 million (22 percent of overnight camps reported revenues more than $2 million, which was also the median for independent, for-profit camps).
Rental income appears to be a growing trend among overnight camps. Compared to 2006, overnight camps now report an average of 13.3 percent of their revenue comes from rentals, conferences, and other supplementary programming.
There are some expected differences across daily fees for day camp sessions and overnight camp sessions. In 2018, we asked camps to report their daily camp fees to better account for variance in session length. Day camps reported a median fee of $53/day, and overnight camps reported $110/day, yet there were notable differences across the various camp types. For day camps, the biggest difference was between agency-based camps and independent, for-profit camps, which averaged $45 and $102 per day, respectively. Independent, for-profit overnight camps, on the other hand, differed most significantly from religiously affiliated camps ($222 and $75 per day, respectively).
Day camp fees and overnight camp fees, from 2006–2018, appear to be on the rise — although not as much as would be expected given that 58 percent of overnight camps and 48 percent of day camps reported they anticipate a fee increase in the coming year. Interestingly, day and overnight camp fees seem to be moving at about the same rate, with minor declines in median fees among independent, for-profit camps (both day and overnight) between 2012 and 2018.
Expenditures
Median expenses in 2017 were $350,000 for day camps and $865,000 for overnight camps, with vast differences across camp types. For independent, for-profit camps, expenses exceeded $1.17 million for day camps and $1.6 million for overnight camps. Personnel was the biggest expense category for both day and overnight camps; however, for day camps, seasonal staff was the largest expense category (38.9 percent of their overall expenses) followed by year-round staff (13.8 percent), while overnight camps reported year-round staff was their biggest expense category (19.7 percent of their overall expenses) followed by seasonal staff (19.5 percent). These numbers have remained relatively stable since 2006.
Profit and Profit Margin
Perhaps the most notable finding from the 2018 Business Operations Survey was that, on average, camps reported a higher profit and profit margin than previous years. Slightly more than half of participating day camps (55 percent) reported a profit in 2017, with a median profit value of $90,000 and a 16.2-percent average profit margin. Overnight camps reported overall less profit (median $10,500) and average profit margin (3.4 percent); however, 45 percent of overnight camps reported profitability, and 28 percent reported earning a profit of $100,000 or more. Sixteen percent of overnight camps lost money in 2018.
The graphs (see this page) are a perfect example of the interesting-not interesting nature of camp financial data. Overall, we see profits and profit margins trending positively in our nearly 12 years of financial data. This is interesting and good news for an industry that took some hits during the 2008–2010 economic downturn. But not so interesting is the up-and-down nature of camps by camp segment, which is a great reminder that no two camps are alike, and camps across our various sectors have different approaches to seeking, achieving, and reporting profitability. Over time, day camps consistently achieve greater profits and profit margins, although with slightly more volatility from year to year, but the difference in profitability between day and overnight camps has stayed roughly the same.
The 2018 Business Operations Report confirmed two long-held beliefs about camp. First, the camp industry continues to thrive, exceeding prerecession metrics for enrollment, revenue, and profits. But we also see evidence of what many camp professionals already know, that camps must look for ways to add camper days (whether by increasing enrollment or expanding days of operation) and identify opportunities for supplementary income, whether from rental groups or alternative income sources, such as school groups, family camp, or adult-focused programming. In general, the business of camp is strong, depending on the type of camp and mission.
Victoria Povilaitis, a research assistant for ACA, is a doctoral student at the University of Utah and has worked in the camp industry in a variety of roles, including staffing coordinator, athletic director, and sports coach.


