Hello Camp Evaluators, and welcome to the second part of my series on measuring camper enrollment. In the first part, I laid the foundation for where measures of enrollment sit in the larger menu of evaluation options and (hopefully!) made the point that no single measure of enrollment, satisfaction, or camper outcomes gives you a complete picture of camp health. In this blog, we will look specifically at measures of enrollment, but the bottom line remains the same: no single measure of enrollment can tell you the complete story. To truly understand if you are serving campers in the ways you hope, you need to look at enrollment from several different angles.
Heads in Bunks: Enrollment as a Measure of Reach
The simplest (and most common) way to measure enrollment is to count the number of campers you serve, and compare these counts across sessions, age groups, participant types (e.g., by gender), or across years. Your formula for this:
Camper 1 + Camper 2 + Camper 3 + Camper 4 + Camper 5 = 5 Total Campers
Easy, right? Easy as counting jelly beans — line them up, count them, put them into piles based on color, shape, flavor. But do your piles of jelly beans tell you anything other than “this is a pile of red jelly beans”? No. Counting campers is nothing more than a snapshot in time, and even though you can compare these snapshots from session to session or year to year, they do not tell you why things are the way they are and how to move forward.
To understand why and how, you need to look at measures of retention and return on investment. Note that I do not include satisfaction on this list: satisfaction, as you might recall, is the over-filled water balloon of camp metrics. Like that over-filled water balloon, satisfaction is heavy with perceived importance, but it is a difficult measure to work with because every person’s baseline for satisfaction is different, and often very private. And satisfaction as a predictor for enrollment? They are two entirely different timelines. Satisfaction changes quickly and in response to small changes, enrollment tends to change more slowly, and in response to larger changes. OK, enough on satisfaction.
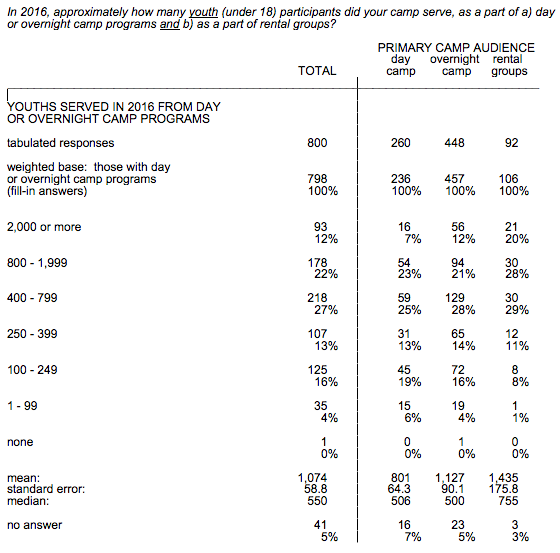
At ACA, we count heads in bunks in order to demonstrate the size and reach of the camp industry. To do this, we ask camps through our various research reports about how many total campers they serve, and we ask camps to break down this total number by age, gender, race/ethnicity, and income level. We find these measures most useful with audiences not familiar with camps — as a snapshot, heads in bunks is a handy measure to show who you serve and how many.
You might be asking, “how do I know what is a good number?” Below is a chart that shows percentages of ACA-accredited camps and the total number of unique campers they serve. The best way to benchmark your data is against yourself, but industry data is the next best option if those data are not available, or if you are embarking on a strategic growth plan.
Retention: Enrollment as a Measure of Effectiveness
Next up on the food chain of enrollment measures are counts of new versus returning campers. Most would agree that is it is cheaper to retain an existing camp family than it is to recruit a new one; however, the extent to which a camp prioritizes returning over new campers depends entirely on their mission, business model, and strategic goals. So I cannot tell you the appropriate mix of new versus returning campers, but I can tell you that camper retention is an important dimension to the enrollment story. Measures of retention tell you not only about the effectiveness of your recruitment efforts, but can also give you a sense of your word-of-mouth engine (cheapest marketing around!), and can help you predict your potential alumni donor base for the future. They are typically an indicator of program quality, and the effectiveness of program features that keep kids coming back for more (e.g., age-up features).
The most common measure of retention is camper return rate. This formula is:
# of camper returning from at least one previous year or session/total # of campers = % campers returning*
*don’t forget to multiply the small decimal you get from this calculation by 100
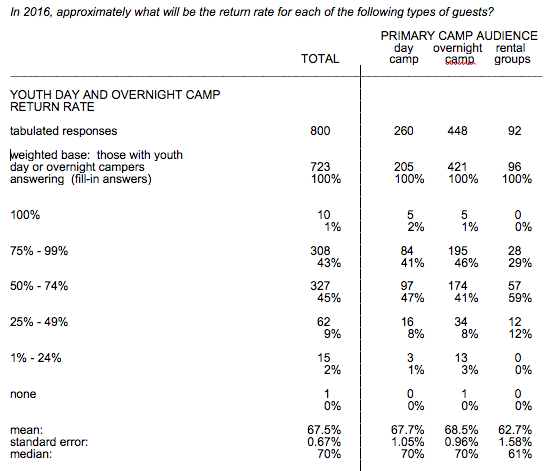
Of course, you might want to dig deeper by looking at two-, three-, four-year plus return rates, or return rates by gender, session, or age. As always, your best point of comparison is your own camp data, and second best are the return rates of camps most similar to yours. The ACA industry data below breaks down return rates by day, overnight, and camps that serve primarily rental groups:
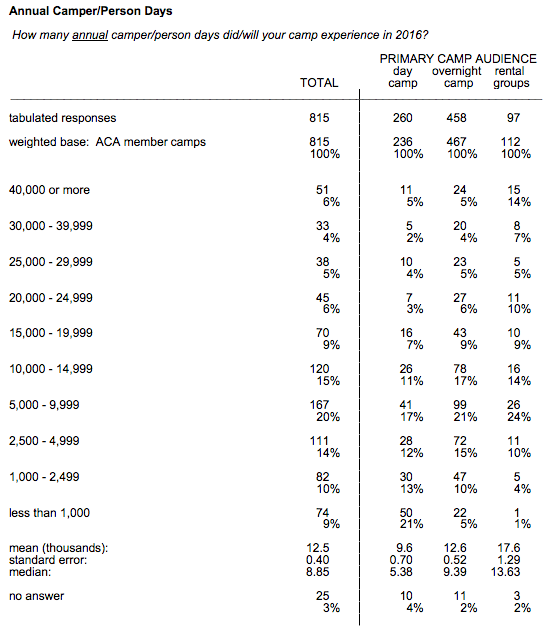
Camper-Days & Occupancy: Enrollment as a Measure of Capacity
Counts of unique campers is an excellent way to demonstrate reach — the number of campers you serve — but it doesn’t tell you anything about how and when those campers were served. Let’s say you serve 800 campers across nine one-week sessions. This is great! With this success you decide to add two more weeks of programming, and once again serve 800 campers. This is not great! You added capacity without adding campers, which likely means you lost money. To better account for capacity, we use the following measure of camper-days:
Total # of campers served* x Total # days of program offerings = camper-days
*note: count repeat campers each day or session they attend camp. For example, in a day camp program, you had about 132 campers each day. You might need to take an average if your day-to-day numbers fluctuate. To get camper-days, multiply 132 by the number of days in the program, which in this example is 45 (9 weeks @ 5 days per week). Your total camper-days is 5,940.
Measures of occupancy work in similar ways, although you are considering the number of campers you served in relation to the number of campers you could serve given the number of bunks, space in buses, or staff members you have. A classic way to measure occupancy is as follows:
(Total # beds filled/Total # beds available)*100 = % occupancy
Or, a less traditional version:
(Total # campers served/Total # campers we have staff coverage for)*100 = % occupancy
So there you have it — a measure of reach (count of unique campers), a measure of effectiveness (retention rate), and a measure of capacity (camper-days and/or occupancy). All three of these measures are probably accessible in your existing data on campers, and possibly automatically calculated by your camper management software. But it’s up to you to decide what to do with these numbers, and how to piece them together to get a more complete picture of your camp’s health.
But it’s still not a complete picture. Join me next time while we dig into some of the juiciest strategies for measuring enrollment, not a single one of which (shocker!) is simple or straight forward. But together, these approaches will give you the best story you can possibly tell about who you are serving and how. Stay tuned!
Photo courtesy of Camp Rainbow Gold in Boise, Idaho
Laurie Browne, PhD, is the director of research at ACA. She specializes in ACA's Youth Outcomes Battery and supporting camps in their research and evaluation efforts. Prior to joining ACA, Laurie was an assistant professor in the Department of Recreation, Hospitality, and Parks Management at California State University-Chico. Laurie received her Ph.D. from the University of Utah, where she studied youth development and research methods.
Thanks to our research partner, Redwoods.

Additional thanks goes to our research supporter, Chaco.
The views and opinions expressed by contributors are their own and do not necessarily reflect the views of the American Camp Association or ACA employees.


