Hello camp pros!
About two weeks ago we emailed a survey to the primary contacts for nearly 2,550 ACA member camps asking them to voluntarily and anonymously complete our 2019 Spring Snapshot Survey. The purpose of the survey was to gain insight into spring enrollment, staffing, and program planning. We asked:
- How many total campers do you expect to serve in summer 2019, and is this number higher or lower than previous years?
- How many staff do you plan to hire for summer 2019, and is this number higher or lower than previous years?
- Are you increasing your programming, either in terms of number of days or amount of program options?
We also asked respondents to explain why they believe their enrollment is higher or lower, why they are hiring more or less staff, and what is driving any changes they are making to their program structure.
A total of 298 camp professionals completed the survey (11.6 percent response rate, which is somewhat typical for these kind of surveys). About 70 percent of the respondents represented overnight camps, 27 percent day camps, and 3 percent said their camp serves primarily rental groups. These as well as the percentages for camp organizational structure (independent nonprofit, for-profit, and agency-based, for example) and geographical region mirror our national ACA camp community, so we can be relatively confident in what these findings say about the population in general.
Enrollment Snapshot
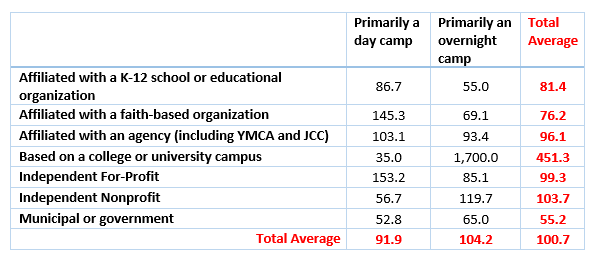
We asked respondents to report the number of campers they expect to serve in summer 2019, not counting repeat campers more than once, and not including non-summer programming. The table below includes the average reported figures by camp organizational structure.

We then asked respondents to indicate whether they expect to serve more, less, or the same number of campers in summer 2019 compared to the previous summer. Over half (53 percent) indicated they expect to serve more campers, 27 percent expect to about the same as they did last year, and 19.5 percent expect to serve fewer campers than in the past. As you can see in the chart below, anticipated growth appears relatively similar across regions (no statistical differences were calculated).
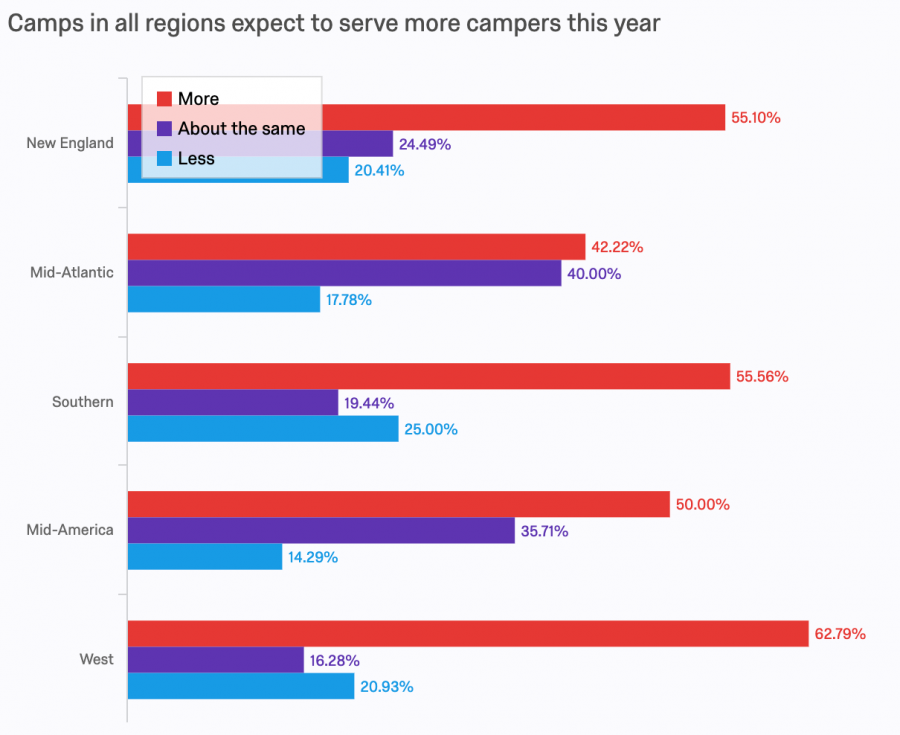
Where we do see some interesting differences in anticipated increase or decrease in enrollment is between camp organizational structures:
- Among respondents representing independent for-profit camps, fewer reported an expected increase in enrollment and more reported an expected decrease compared to independent nonprofit and agency-based programs.
- More respondents from agency-based programs reported expected growth in enrollment compared to all other camp sectors (and had the fewest number of folks reporting an anticipated decrease in enrollment).
To learn more about enrollment trends across camper demographic groups, we asked respondents to report if they anticipated higher, lower, or about the same enrollment among campers of the following camper characteristics (percentages represent total number of survey respondents who indicated higher, lower, or same):
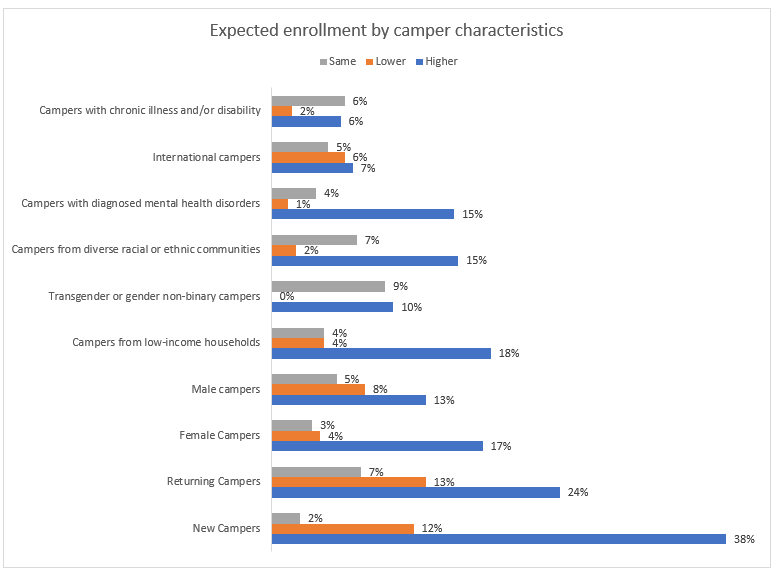
It is important to remember here that we asked folks for their best estimates related to enrollment, so we cannot be certain if this represents actual enrollment or trends over time. Still, it is worth thinking about the different campers that you serve and whether enrollment of campers of specific characteristics such as these are aligned with your enrollment goals.
Note: We asked about change in enrollment compared to last year, so it is reasonable to guess that the 38 percent of respondents who indicated enrollment of new campers is higher than expected means they are getting more new campers than in the past---this is good, as are the increases in all of the categories listed in the chart above.
Staffing Snapshot
Earlier this month we posted a summary of the 2019 Staff, Compensation, and Benefits Report, which contains average hiring numbers in far greater detail than we explore in this survey. To get a sense of anticipated hiring for summer 2019, we asked respondents to tell us how many seasonal staff, including volunteers and part-time staff, they expected to hire. We see the most notable differences across camp organizational structures, with only minimal differences by camp type (day and overnight) and region.
One place we see some interesting data is when we compare expectations of hiring more or less staff with anticipated enrollment. Almost a quarter (26 percent ) of the respondents who expected an increase in enrollment plan to hire additional staff, while a similar percentage (24.2 percent) plan to hire about the same number of seasonal staff.
When asked why they planned to hire more or less staff compared to last year, respondents shared some of the following reasons:
- More campers
- More programs
- Parent expectations
- Added new positions, like camper support specialist
- Couldn’t find enough last year
- To minimize paying overtime
Program Snapshot
To get a sense of how camps are planning their program in response to increased or decreased expected enrollment, we asked if the respondents were expanding or decreasing the number of programming days and/or the amount of program options. There was little difference between the two, but, when combined, just over 27 percent of respondents indicated some sort of program expansion.
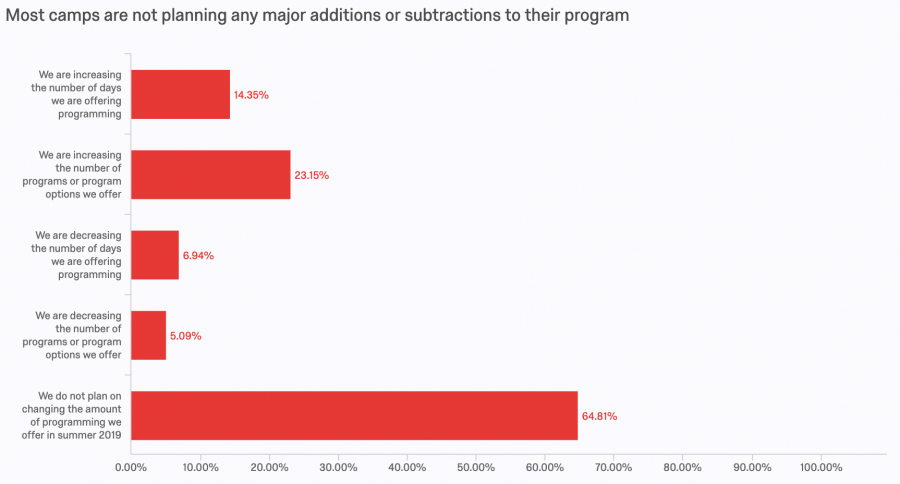
When asked to describe program additions, respondents said they planned to add more adventure and environment education programs, the addition of programs for new age groups (toddlers, high schoolers, and families), and new topical areas, including bee keeping, calligraphy, and puppy training.
The last question on the survey asked if folks had anything else they’d like to share regarding their preparations for the 2019 summer season. Some themes include:
- Late and low overall enrollment
- Increased enrollment in younger age groups
- Challenges hiring male staff
- Challenges hiring aquatic staff
- Challenges hiring any staff
- International staff struggle to get visas
In general, the 2019 season looks promising for most camps, but is not without impending challenges. A big thanks to the 298 ACA members that shared their insights so we can get a sense of how our own planning compares to camps across the country. As always, camp data is a give-some-get-some kind of thing, so the more people that respond to our surveys, the better our ability to make generalizations and predictions about camp enrollment, staffing, and program planning.
In the meantime, check out past Research 360 blog posts for lots of ways you can incorporate data like this, as well as your own evaluation information, into your summer planning.
Laurie Browne, PhD, is the director of research at ACA. She specializes in ACA's Youth Outcomes Battery and supporting camps in their research and evaluation efforts. Prior to joining ACA, Laurie was an assistant professor in the Department of Recreation, Hospitality, and Parks Management at California State University-Chico. Laurie received her Ph.D. from the University of Utah, where she studied youth development and research methods.
Thanks to our research partner, Redwoods.

Additional thanks goes to our research supporter, Chaco.
Photo courtesy of Camp Gray Catholic Camp in Reedsburg, WI
The views and opinions expressed by contributors are their own and do not necessarily reflect the views of the American Camp Association or ACA employees.


