Wow — am I glad you are here! I know all about the camp professional's life this time of year: nuts. But what I have to share with you is probably just what you are thinking about right now, and will hopefully help you navigate at least one of the 10,000 things you are trying to figure out.
Staffing. Recruitment, hiring, training, retaining: all hard stuff for camp professionals, especially at a time when school calendars and the complex needs of emerging adults are making it challenging to do our staffing like we've done it in the past.
We are thinking about the challenges camps face around staffing a lot here at ACA. You've probably seen the work of Project Real Job. If not, check it out and use these great resources as you prepare your staff for summer. Also (in your free time, haha), check out ACA's Impact Study, which includes research on staff and leadership development at camp.
Today I'm going to share a snapshot of new data we collected from ACA camps about all things staff-related. Want more than just a snapshot? The 2019 Staffing, Compensation, and Benefits Report is available for free….yes, for free….this year for two reasons:
- We received fewer responses for this survey than in the past, making the data less reliable for generalizing to the larger camp population. A third-party research firm emailed the online survey to the primary contact for 2,373 ACA member camps in November 2018. A total of 426 of those contacts completed the survey, which represents an 18% response rate. This number is not bad, but it's not as good as the approximately 40% response rate we've gotten on previous surveys. What's more is that the percentages of respondents from independent nonprofit camps, agency-based camps, and faith-based camps do not represent exactly the percentages in our membership as a whole, so the data might be what we call skewed. What does this mean? It means that we want to interpret the data with caution and with the understanding that the numbers might not represent all camps or all situations.
- We are moving to a new system of collecting and sharing national data regarding camp operations. For over a decade we've worked with the third-party research firm to track operational issues in annual surveys related to enrollment, camper and staff demographics, camp programming and facilities, staffing, and budget issues, and we made these reports available for purchase for members and nonmembers. But the ways we are using the data and the ways camps are using the reports require a new and more customizable approach, so this is the last year we will offer the reports in their current format. We are excited to celebrate this new direction by giving the 2019 report to ACA members for free!
Okay, with those pieces out of the way, let's look at the data. Keep in mind that the survey was administered in November 2018 and reported in spring of 2019, so we call this the “2019 Staffing, Compensation, and Benefits Report” because that is when it is officially published. But the numbers reflect the 2018 camp season.
Revenue & Enrollment
We ask about revenue and enrollment in each of our annual surveys to help establish the context for the specific data collected that year. Here I'm comparing gross revenue by camp type from the 2018 survey with the gross revenue data we collected from this same survey three years ago (data were collected in Fall 2015 and reported in 2016, which is why we call it the "2016 Staff, Compensation, and Benefits Report"). To get more detail about camp financial benchmarks, you'll have to check out the 2018 Camp Business Operations Report.
Median Gross Revenue
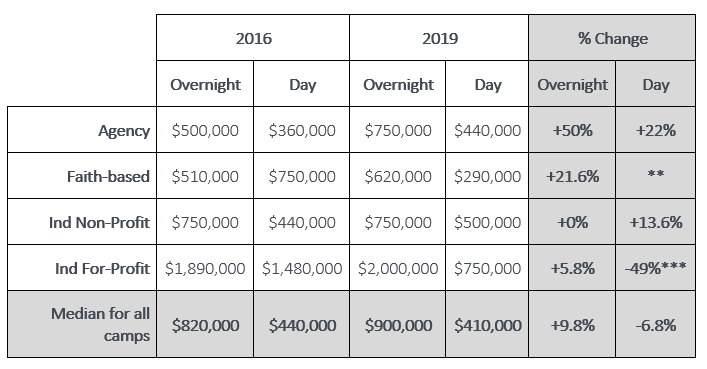
- Note: Median = the middle, when you line up all responses small to large. Not the mean, or the average, which represents all values combined. Median is often a better indicator of “the norm” in camp data because we have more very very big camps than very very small camps, thus the average it usually a biased toward those large camps.
- **Very few faith-based day camps reporting, so large change from 2016 to 2019 cannot be generalized to all faith-based camps
- ***Interpret with caution! This number represents only 35 camps, which is too small to generalize across all independent for-profit camps
Enrollment per Camper-Days
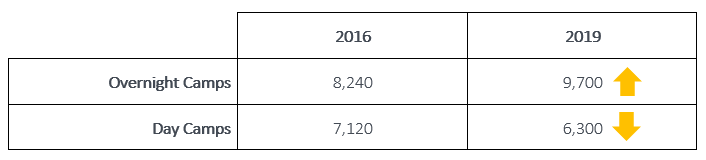
- Camper-Days = number of campers on any given day x number of days in operation. This is really a measure of enrollment and capacity, so increases or decreases could be due to change in the number of days in operation and/or change in the number of campers.
Key takeaway: Revenue is growing. Camper-days are increasing at overnight camps (more rental and nontraditional programming perhaps?) and decreasing at day camps (school calendars shrinking the amount of time available for summer programming?). But, let's remember that the 2019 data must be interpreted with caution!
Staffing Numbers
We asked respondents how many staff they hired in 2018, specifically in the categories of year-round staff (full-time and part-time), seasonal staff, and volunteers. I'm leaving out volunteer staff here because those numbers are all over the map – independent nonprofit overnight camps, for example, report hiring an average of 186 volunteers while day camps within that segment report an average of 14 volunteers. Volunteers are a major part of the camp staffing equation, so I encourage you to check out the full report to see staffing numbers that include volunteer averages.
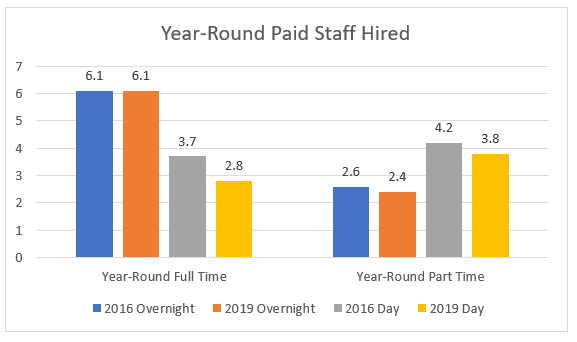
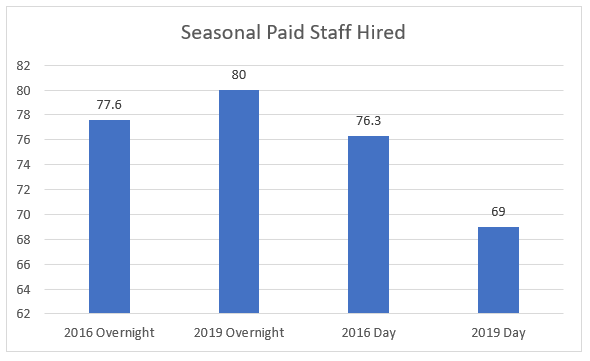
Key takeaways: Some trends to pay attention to here. It looks like overnight camps are hiring more seasonal staff compared to 2016, but this is perhaps related to “over-hiring” to prepare for staff absences and staff leaving early. According to this survey, 52% of camps hired 5% or more over their staffing target to account for expected attrition. It does not appear that full-time staff numbers at overnight camps have changed significantly. Seasonal staff at day camps declined notably, as did year-round staff, to a slightly lesser degree. What does this mean? Hard to say, but it's interesting to note given the decline in camper-person days reported by day camps in 2018. Also interesting, the percentages of international staff did not appear to change significantly from 2016 to 2019, even through almost a third of the respondents this year said that recruiting international staff was more difficult than in the past.
Show Me the Money
How much are you paying your staff this summer? Are you feeling pressure to pay more? Anticipating the hit of increased minimum wage? We asked survey respondents to tell us what they pay key staff at their camps, including director, assistant director, other common year-round positions, and seasonal staff, ranging from traditional camp counselor positions to specialist positions and program directors. You'll have to check out the full report for salaries across this range of position types, but here are the biggies.
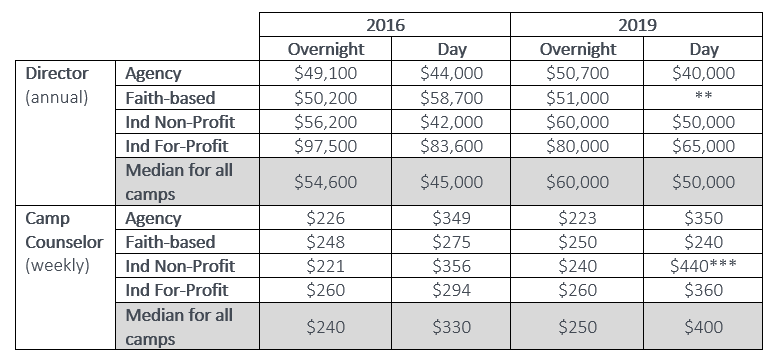
- Note: All figures above represent the median, not average.
- **Not enough data available to report
- ***Based off of 34 camps, not enough for a very reliable estimate for all independent nonprofit camps
Key takeaways: Given small sample sizes when we break the data into these smaller chunks, we cannot read too much into the changes we see from year to year. In general, salaries appear to be increasing as we would expect. The decline in director salary in independent for-profit camps might be a function of the particular camps that completed the survey in these years, or it could be related to turnover at the director level. In 2016, 32% of reporting camps indicated they had a director with 20+ years experience; in 2019, that number dropped to 17%. The average tenure for camp director at the given camp was 14.9 years in 2016 and 10.4 years in 2019, so it is possible the decline in salary in independent for-profit camps is related to generational shifts at the director level.
One more point of interest, and that is the notion of staff pay as a key challenge related to staff recruitment and retention. In both the 2016 and 2019 surveys, we asked respondents about anticipated pay increase for seasonal staff; in 2016, 34% of respondents from overnight camps reported they anticipated increasing frontline staff pay in the next year at an average rate of 1.5%. Both numbers increased in 2019: 55% of respondents from overnight camps indicated they anticipate increasing frontline staff pay in the next year at an average rate of 3.1%. Respondents from day camps were similar: 66% anticipated a pay increase at an average rate of 3.9%. If staff pay is truly a barrier, then the data suggest that camp directors are doing what they can to address the issue.
So, how can you use these findings? You can use them cautiously, and in combination with other data sources, most importantly data from your specific program and, if possible, data from camps very similar in terms of size, focus, and region. For more on using industry data for operational decision making, check out this blog on benchmarking.
And don't forget to download your free (ACA members only!) copy of the 2019 Staffing, Compensation, and Benefits Report to learn more about:
- Staff demographic characteristics
- Number of staff hired, including seasonal, year-round, international, and volunteer
- Salaries, benefits, and retention among seasonal and year-round staff
- Recruitment practices and challenges
- Staff training and professional development
Laurie Browne, PhD, is the director of research at ACA. She specializes in ACA's Youth Outcomes Battery and supporting camps in their research and evaluation efforts. Prior to joining ACA, Laurie was an assistant professor in the Department of Recreation, Hospitality, and Parks Management at California State University-Chico. Laurie received her Ph.D. from the University of Utah, where she studied youth development and research methods.
Thanks to our research partner, Redwoods.

Additional thanks goes to our research supporter, Chaco.
Photo courtesy of Camp Cherith in the Carolinas, Clemson, South Carolina.
The views and opinions expressed by contributors are their own and do not necessarily reflect the views of the American Camp Association or ACA employees.


