You’ve probably gathered by now that, here in the research wing of ACA, one of our favorite pastimes consists of developing surveys, studies, and evaluations that help us expand the value and visibility of the camp experience. Whether it’s looking at camper outcomes, parent feedback, virtual program evaluation, or any other critical component of the camp experience, chances are, our team is dedicated to finding ways to help you assess, plan, and improve.
As part of our Business Research Program, ACA conducts three unique surveys on a rotating basis focused on: (1) staffing, compensation, and benefits; (2) business operations; and (3) sites, facilities, and programs. Reports detail findings by camp type, location, and business model. We detail high-level findings in Research 360 blogs, and full reports are available here.
Over the past two years, we have been working to revamp these surveys so we can provide more usable data to support your operational decision making. (You may remember Laurie Browne, PhD, mentioning this last year when she shared out the latest data on staff, compensation, and benefits). This year, we took a look at our Sites, Facilities, and Programs Report. Not surprisingly, our goal with this study was to better understand ACA member camps’ sites, facilities, and program features. More importantly, we wanted to understand this information based on the type of programming they provided. While we’ve still got a bit of fine tuning to attend to, we think there’s a lot of great information in there that we wanted to share!
Focusing in on day camps, of the total 679 member camps who responded to this survey, 194 said they offered day camp programming only. Approximately 40 percent of respondents indicated they offer some combination of day and overnight programming, but we are focusing on those that identified as day camp only because it is difficult to extrapolate the day-only data from the combination camps. A full report on camps offering day and overnight camp programming is available here.
In this summary of day camps, all five ACA regions are represented, and nearly all camps reported a 2019 annual operating budget of less than $5 million. A little less than half of the participating camps identified as nonprofit camps affiliated with another entity (of which about half indicated that the other entity was a youth-serving agency). Most said they provided mostly summer programming and served mixed-gender groups of participants.
Below you’ll find a snapshot of some of the key takeaways from the Day Camp Report, as well as some ideas on how you might be able to use this information. Curious about Overnight Camps? Not to worry, a blog dedicated to the Overnight Camp Report is coming soon!
Here’s what we learned about . . .
. . . the participants:
- Of the few day camps that said they served special populations, these camps only said they served participants with specific health or medical diagnosis or diagnoses.
- Most participants were aged 6-12 years old, White, and from middle- or high-income families. Very few participants identified as American Indian or Alaska Native, or Native Hawaiian/Pacific Islander.
. . . enrollment:
- Enrollment varied widely amongst day camp only member camps. Camps in the New England and Western regions, and Independent for-profit camps served the most unique participants in 2019.
- Enrollment per session also varied widely among day camp only member camps. The Mid-Atlantic region and Independent for-profit camps served the largest number of participants per session in 2019.
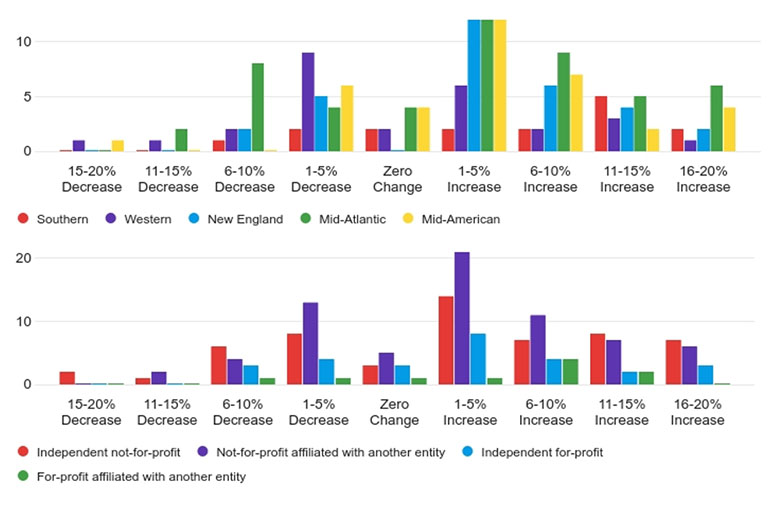
Overall, day camp only member camps noted growth in their enrollment, with camps in the Mid-Atlantic region seeing the most gains.

- Most day camp only member camps said that 51%-90% of their participants returned after their first year.
. . . sessions:
- Over half of day camps offered weeklong (5–7 days) sessions. Many also indicated offering two-week sessions as well as multi-week sessions lasting 2–9 weeks or more.
- The most typical session offering was one week.
- Most day camps offered 1–60 days of active programming.
. . . partners:
- About two-thirds of the day camp only member camps did not partner with outside organizations for programming or recruitment.
- Of the camps that did work with outside organizations, the most common partnerships were with a K–12 school or school district, followed by partnerships with STEM-focused and sports organizations.
. . . programming:
- Almost three-quarters of day camp only member camps said they incorporated academic curricula/academic standards into their programming.
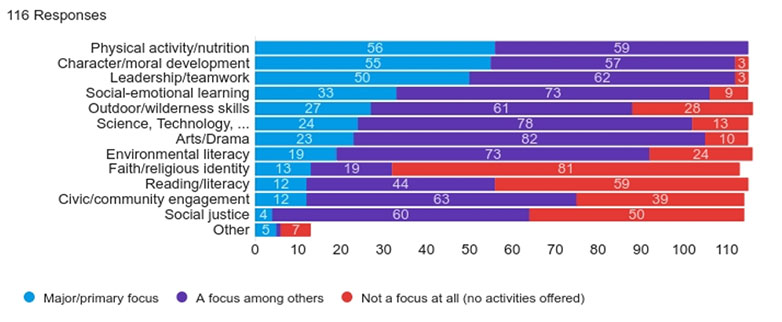
Physical activity/nutrition and character/moral development were major programming focuses of day camp only camps. Many also said leadership/teamwork and social-emotional learning was a major programming focus. Very few camps said that civic/community engagement, social justice, or reading/literacy was a programmatic focus.

. . . Counselor or Leader-In-Training Programs:
- About three-quarters of day camp only member camps said they had a CIT or LIT program, and most had 1–20 participants.
- Most CIT/LIT sessions lasted 1–8 weeks, and more than two-thirds of camps said that 21%-50% of their CIT/LIT participants returned as staff.
. . . day camp facilities:
- Less than half of day camp only member camps said they owned the property where their primary programming occurred.
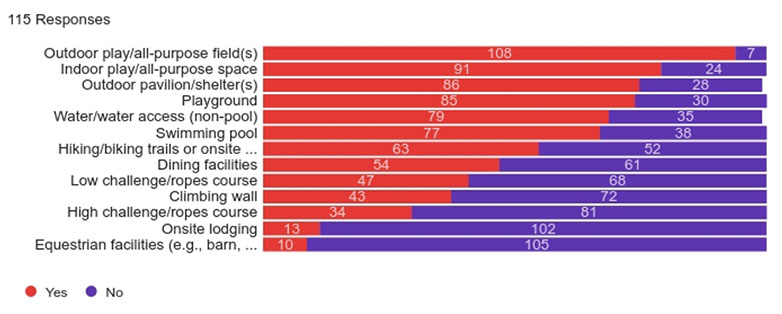
A variety of features are available on properties where day camps provide programming. Outdoor/all-purpose fields, indoor all-purpose space, outdoor pavilions, playgrounds, access to non-pool water, and swimming pools were the most frequently reported.

- Very few day camps said they have onsite lodging, and less than half had access to a lake or pond on their property.
. . . off-site programming:
- Three-quarters of day only member camps said their participants traveled away from the primary camp location at some point during the session (such as for field trips or for other regular programming).
The most commonly reported locations visited for off-site programming were museums, zoos, and sports facilities.
So how can you use these findings? Again, I’d like to quote my supervisor, Laurie Browne, PhD, by saying “cautiously, and in combination with other data sources, most importantly data from your specific program and, if possible, data from camps very similar in terms of size, focus, and region.” And now would probably be a good time to address some of the elephants in the room. Obviously, COVID-19 is having a profound effect on camps, campers, staff, and families and the Black Lives Matter movement has highlighted not only camp accessibility, but also its role as a safe, supportive, and culturally empowering experience. So while benchmarking might be tough this time around, these findings offer us all a great opportunity to hit pause, reflect on where we’ve been, and strategize how we want to move forward.
Read the full 2020 Sites, Facilities, & Programs Study Report for Day Camps.
Curious about overnight camps? Stay tuned for the next blog, which will be dedicated to those survey results!
Photo courtesy of Tall Pines Day Camp.
Thanks to our research partner, Redwoods.
Additional thanks goes to our research supporter, Chaco.
The views and opinions expressed by contributors are their own and do not necessarily reflect the views of the American Camp Association or ACA employees.


